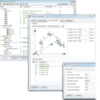
The main features are:
- Besides allowing to write, compile and debug the application software, it permits to evaluate the behaviour of the controlled machine and therefore to choose the best solutions to optimize it
- RDE is supported on Windows 10 x64 systems, with build 1703 and later
The controller is connected to the PC via serial/ethernet channels (TCP/IP) - RDE offers the following main features:
- Writing, with its highlighting integrated editor, the R3, RPE, Ladder, Object block source files. These files can also be written with any other pure ASCII editor
- Compiling the source files and obtaining the report of errors addressing to the code line containing the error
- Organizing all the files belonging to a particular job into homogeneous groups (see Project window in the usage examples)
- Communicating on a serial/ethernet line with the Robox motion controller, through the Shell window (see Usage examples). This window allows to:
– monitor the state of any hardware resources of the connected controller
– read the directory of the files in the flash card of the connected controller
– move any file from the PC memory to the flash card and viceversa
– delete files, etc. - Displaying in a numerical form the registers/variables of the connected controller through the Monitor windows
- Displaying in a graphical form the evolution of the involved variables through the Oscilloscope window (see Usage examples). This windows works as a 4/8-track oscilloscope, for which it is possible to define the variables associated to each track, the scale and offset, the synchronisms, if normal or XY display
- Setting Debug utilities, such as:
– break-points on the execution of an instruction (stopping the execution or just counting the event occurrences)
– break-points on a variable read operation
– break-points on a variable write operation
– trace on tasks - Simulating, through the I/O Panels window, the system inputs/outputs. The possibility to force the inputs and to display the outputs permits the programmer to thoroughly debug the program without actually being connected to the machine
- Using the Variable Load/Save window to create customized parameter menus
- On-line help facility
- All the above features are available for teleassistance through Internet
- Download from our site.
Use examples
Tool: Shell Window
The Shell window enables to communicate, with the active connection (RS232, RS422, USB, TCP/IP), with the motion controller.
The Shell window allows the following main operations:
- monitor the state of any hardware resources of the connected controller (digital and analog inputs/outputs).
- read and edit the value of any real or integer registers of the connected controller.
- read the directory of the files inthe flash card of the connected controller.
- move any file from the PCmemory to the flash-card and viceversa.
- delete files.
- etc.
RTE Project window
The Project window allows to organize all the files belonging to a particular job into homogeneous groups.
It is divided into 4 tabs for better helping the programmer to:
[Configuration] Configure the axes, the power sets, the fieldbus line etc…
[programs] Write the programs
[Debugger] Debug his program using breckpoints, step/step, live modification etc…
[File in flash] Compose the list of files that must be download into the motion controller
Tool: Monitor window
The Monitor window allows to display in a numerical form the remote variables of the connected controller (registers, DI, DO, AI, AO, predefiend variables, structures etc.).
The Monitor window allows to continuously monitor and display the values and variables of a remote device (e.g. uRmc2, uRmc3 and RBXM). Values can be displayed in numerical format (decimal, hexadecimal) and alphabetic format (string, hex string dump, etc.). Values can be also modified.
Debug window
The Debug window allows to go ON-LINE on the remote device.
The Debug window allows the user to:
- Watch the system report.
- Watch the user report.
- Obtain information about the breakpoints.
- Follow step by step the programs.
- Obtain information about the OB.
Editor window
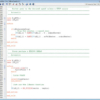
A powerful text editor integrated in the RDE package can be used to edit any structured text (R3) source file, for ladder diagrams there’s a specific graphic aleditor. If preferred, the use of Notepad++ for structured text source files is possible and configurable.
Tool: Oscilloscope window
The Oscilloscope window displays in a graphical form the evolution of the involved variables.
The Oscilloscope window works as a real 30-track oscilloscope (up to 24 acquired from the remote device), for which it is possible to define:
- the variables associated to each track.
- scale and offset.
- synchronisms.
- normal (versus time) or XY display.
This post is also available in: Italian
